UPWARD MIGRATION OF ANTHROPOGENIC CO2 AND VERTICAL FINITE
ELEMENT MESH RESOLUTION IN A LAYERED SEDIMENTARY BASIN
A. Comerlati, M. Ferronato, G.
Gambolati, M. Putti, P. Teatini,
Università di Padova
Copyright OMC 2003
This paper was presented at the
Offshore Mediterranean Conference and Exhibition in Ravenna, Italy, March
26-28, 2003. It was selected for presentation by the OMC 2003 Programme
Committee following review of information contained in the abstract submitted
by the authors. The Paper as presented at OMC 2003 has not been reviewed by the
Programme Committee.
ABSTRACT
A possible option for the greenhouse effect mitigation is the disposal
of anthropogenic CO2 into deep geological formations. Reliable
numerical finite element models are required to simulate correctly the basic
processes which underlie and control the safe storage of CO2 of
industrial origin. The large saline aquifers of the Northern Adriatic basin
appear to be promising porous bodies to sequester a significant amount of CO2
produced by nearby thermoelectric plants. In the present communication the
influence on the upward CO2 migration of local clay units within a
permeable formation is investigated. Finite element simulations are performed
to address the gas break-through in a silt/shale lens embedded in a realistic
Northern Adriatic aquifer where anthropogenic CO2 is injected. The
vertical mesh resolution is shown to impact quite significantly on the upward
CO2 flow and emphasizes the need for a properly refined mesh to
ensure reliable confinement prediction.
INTRODUCTION
Since 1850, the amount of anthropogenic
carbon dioxide discharged into the atmosphere has risen from preindustrial levels of 280 ppm to the present
level of 365 ppm [1]. The global CO2 fossil fuel emissions in 1999
was 6.4 GtC/year [2] with Italy’s contribution amounting to 0.113
GtC/year.
To stabilize the increase of CO2 concentration in the
atmosphere an attractive option may be the so called carbon dioxide
sequestration which involves capturing carbon from the fossil fuel or the
combustion flumes before they reach the atmosphere. For example CO2
could be separated from the thermoelectric power plant flue gases, transported
and stored into suitable tanks for safe disposal. Several long-time
sequestration strategies have been identified, such as sequestration in oceans,
in terrestrial ecosystems, and in deep geological formations. The last option
provides interesting perspectives especially because the injecting technology
is available and routinely used by petroleum industry for EOR (Enhanced Oil
Recovery), ECBM (Enhanced Coal Bed Methane) and CSGER (Carbon Sequestration and
Enhanced Gas Recovery).
Saline aquifers offer great potential for disposing large volumes of
carbon dioxide. The total available volume for sequestration has been estimated
in the range between 87 GtC and 2700 GtC [3]. In Italy, the Northern Adriatic
sedimentary basin is characterized by the presence of important gas fields and
extensive saline aquifers, with the latter ideal candidates to store large
amounts of industrial CO2. The major Northern Adriatic saline
aquifers are basically horizontal with groundwater confined between the caprock
and the basement, which can be both regarded as hydraulic barriers.
At the
depth of interest, which may exceed 800-1000 m, the carbon dioxide is in
supercritical thermodynamic conditions. As a result at a pressure of 100 bar
and a temperature of 40 ºC the density of CO2 is about 60 % that of
water and viscosity 10 times smaller [4]. Because of this density difference
buoyancy occurs. Once the injected carbon dioxide moves upward towards the low
permeability caprock, leakage may be possible. In this paper escape through
thin silt/clay layers embedded in the saline aquifer is numerically
investigated using a finite element two-phase flow model for carbon dioxide and
groundwater. Carbon dioxide dissolution into the groundwater and geochemical
reactions are neglected because they are relatively slow processes at the
expected formation temperature and over the time scale of the numerical
experiments [5,6,7].
The
present communication is organized as follows. The basic equations and the
numerical techniques for their integration are first briefly reviewed. A
layered sample formation of the Northern Adriatic is presented, with sand
embedding silt layers and confined by clay barriers. Injection of CO2
is simulated with meshes at different resolution and convergence of the
numerical solutions to the theoretical analytical solution is investigated. The
numerical results are presented and discussed, and some recommendations made
for a reliable prediction.
BASIC
EQUATIONS
The system of partial differential equations (PDEs) governing the two-phase flow of gaseous CO2 and water in a porous medium can be written as [8,9]:
![]() (1)
(1)
 (2)
(2)
where the quantities with subscripts w
and g refer to the water and gas
phases, respectively, rw and rg are the densities, Krw and Krg
the relative permeabilities, and mw and mg the kinematic viscosities; k = diag(kx, ky, kz) is the intrinsic permeability tensor of the porous
medium; pw and pg are the pressures, g is the gravity constant with hz = (0,0,1)T;
Sw and Sg are water and gas
saturation, f is the porosity; pc
denotes the capillary pressure (pc
= pg-pw) and the term s depends on the elastic storage
coefficient Ss of the
geological formation as s = Ss
[1-Sg]/g.
The system of PDEs (1) and (2) is highly nonlinear due to saturation
dependence on the relative permeability and capillary pressure and also to the
phase pressure dependence on density and viscosity. Tabular data provided by
Vargaftik et al. [4] are used to account for the real gas behavior.
NUMERICAL
MODEL
The system of PDEs is discretized in space using linear finite elements
(tetrahedra in 3D) yielding the following nonlinear system of ordinary
differential equations:
![]() (3)
(3)
where u = (pw1,pw2,...,pwn,Sg1,Sg2,...,Sgn)T is the vector of the
unknowns, K is the stiffness matrix, C the mass matrix and q accounts for source/sink terms and
boundary conditions. The temporal discretization is implemented via backward
Euler using a finite difference scheme, obtaining the following fully implicit
formulation [9,10]:
![]() (4)
(4)
where Dt is the time step size.
At each time step a nonlinear system of algebraic equations is obtained,
which is solved by means of the Picard linearization method [11]. To ensure
convergence, the time step sizes during the transient simulation are
dynamically adjusted. The simulation begins with an initial time step Dt0 and proceeds
until time Tmax. Two
iteration thresholds are set: maxit1
and maxit2. The current
time step size is increased by a factor Dtmag (to a maximum
size of Dtmax) if convergence is achieved in fewer iterations than maxit1, it is left unchanged
if convergence requires between maxit1
and maxit2, and it is
decreased by a factor Dtred (to a minimum of Dtmin) if
convergence requires more than maxit2.
If the iteration does not converge, the solution at the current time level is
recomputed (“back stepping”) using a reduced time step size (factor Dtred, to a minimum
of Dtmin). For the first time step of a transient simulation, or for steady
state problems, the initial conditions are used as the first solution estimate
for the iterative procedure. For subsequent time steps of a transient
simulation, the pressure head solution from the previous step is used as the
initial estimate. Thus time step size has a direct effect on convergence
behavior, via its influence on the quality of the initial solution estimate
[12].
The
nonsymmetric linear system of equations arising from each nonlinear iteration
is solved by means of ILU-preconditioned Bi-CGSTAB (Bi-Conjugate Gradient
STABilized) projection method [13]. The solver iterations are stopped when the
relative residual norm is smaller than a given tolerance.
NUMERICAL
SIMULATIONS
In the Northern Adriatic basin several
saline aquifers offer the possibility for storing large amounts of carbon
dioxide. One of them is the so called "Chioggia Mare" aquifer, which
is located south of the
Venice Lagoon and is about 1200 m deep. As is typically the case in sedimentary
basins, the “Chioggia Mare” aquifer is characterized by a highly heterogeneous
vertical structure with several sandy formations confined by thin low permeable
silty-clayey layers, that practically act as a real barrier to the fluid
escape.
A local
numerical simulation is performed to analyze the vertical flow of gaseous CO2
in the presence of alternating sandy and silty or clay layers. The
petrophysical properties of sand, silt, and clay are those typical of the
Northern Adriatic basin [14] and are summarized in Tab. 1. A vertical
anisotropy ratio of 10 for the hydraulic conductivity tensor is assumed.
Tab. 1:
Permeability
and porosity
|
|
Permeability [mD] |
Porosity |
|
Sand |
140 |
0.28 |
|
Silt |
0.3 |
0.10 |
|
Clay |
3×10⁻⁴ |
0.06 |
The
axi-symmetric layered porous medium used as a test problem is shown in Fig. 1.
Gaseous CO2 is supposed to be injected into the lower sandy layer along
the vertical axis at a depth of 1183 m. Injection is controlled by a Dirichlet
boundary condition on gas saturation Sg,
set at 0.3. The two-phase flow is simulated for 5 years with different vertical
mesh resolutions. The discretization shown in Fig. 2 is the coarsest one and
will be denoted as mesh 1. Mesh 2, 3, and 4 are obtained from mesh 1 by
subdividing each original vertical spacing Dz into 2, 4, and 8 sublayers
respectively, so that the resulting FE system totalizes 10584 equations in the
coarsest grid and 79380 in the finest.
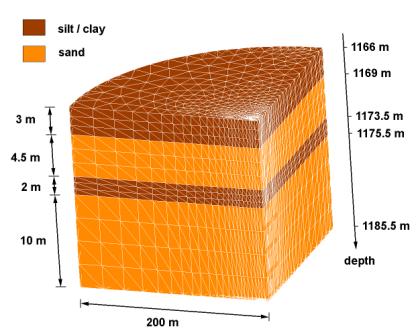
Fig.1: Finite Element discretization of the sample porous medium. The vertical exaggeration is 10.
In
the first set of simulations the sandy layers are confined by silty formations.
The simulated flow of carbon dioxide is shown vs. time in Fig. 2 for the finest
finite element grid. The gas moves upward from the injection point because of
buoyancy and the bubble migration is delayed by the silt layer. After 5 years
about 50 % of injected gas has moved to the upper layers.
It is interesting to look at the convergence behavior of the overall numerical solution as the finite element grid is progressively refined. For that we report in Tab. 2 the error norm computed on Sg values vs. mesh level. The error at the ith level is evaluated as the difference between the numerical solution at the ith level and the numerical solution at the finest level (mesh 4), taken to be the “pseudo” analytical solution. Only the nodes of coarsest level are considered, because these nodes are shared by the various meshes. Observe that at each time step the norm decreases by a factor of about 2 at each refinement level. This provides evidence of the importance of a preliminary analysis on numerical convergence of the model to avoid large discretization errors.
Tab. 2:
Euclidean
norm of the solution difference vectors obtained with mesh 1, 2, 3, and 4 along
the injection axis for gas saturation Sg
|
Time |
Mesh 1-4 |
Mesh 2-4 |
Mesh 3-4 |
|
1
year |
0.1626 |
0.0991 |
0.0413 |
|
2
years |
0.0837 |
0.0528 |
0.0178 |
|
3
years |
0.1060 |
0.0640 |
0.0233 |
|
4
years |
0.1079 |
0.0695 |
0.0266 |
|
5
years |
0.1252 |
0.0759 |
0.0311 |
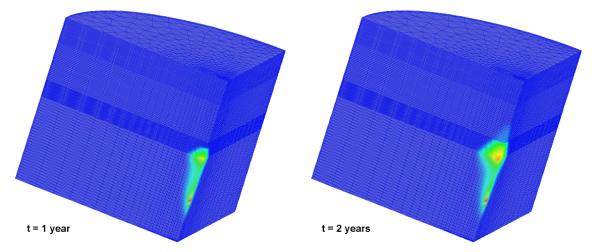
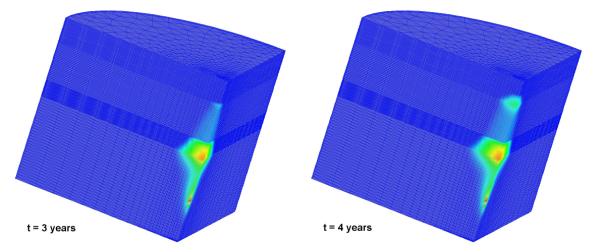
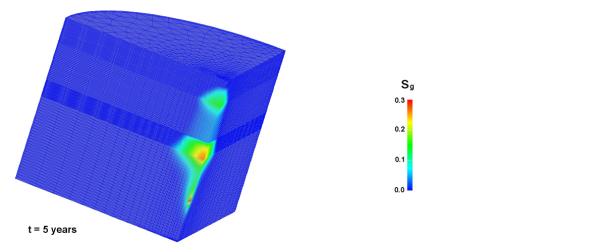
Fig.2: Gas saturation vs. time with the finest grid and silty confining layers
Tab.
3 shows the total CO2 mass (in tons) injected during the 5-year
simulation and stored into each layer. The layers are numbered progressively
from top to bottom. The estimation of CO2 mass disposed in the
sample porous medium is influenced by the finite element resolution used. The
total amounts appear to converge, as expected, to a final value as the grid is
refined. From an engineering point of view, we could say that convergence has
practically been achieved at a value of about 70 tons with mesh 3 and 4.
However, much care must be paid in generating an adequate mesh because the
amounts of CO2 stored can be largely overestimated (in this case by
a factor larger than 2) with a coarse grid.
Tab. 3:
Total
amount of CO2 (in tons) stored into each layer after the 5-year
simulation with mesh 1, 2, 3, and 4
|
Mesh |
Silt #1 |
Sand #2 |
Silt #3 |
Sand #4 |
Total |
|
1 |
9.7 |
34.5 |
23.5 |
74.6 |
142.3 |
|
2 |
6.3 |
26.2 |
19.1 |
48.0 |
99.7 |
|
3 |
4.0 |
19.8 |
15.7 |
36.6 |
76.1 |
|
4 |
3.0 |
17.4 |
14.3 |
33.3 |
68.0 |
A
second set of simulations is performed assuming that the permeable formations
are confined by almost impermeable
clayey layers (see Tab. 1). The simulated flow of carbon dioxide vs. time is
shown in Fig. 3 for the finest finite element grid. In this case, the gas moves
upward from the injection point until the first clayey layer is encountered. We
can observe that a permeability decrease by 3 orders of magnitude reproduces an
impermeable hydraulic barrier confining the injection formation. After 5 years
the injected gas is confined within the lower aquifer, with the only loss due
to a numerical problem accounted for by the permeability jump at the interface
between the sandy and clayey elements. In fact, as the grid is refined and the
interface element size correspondingly reduced, the amount of CO2
migrated to the clay layers confining the injected bubble becomes very small
(see Tab. 4).
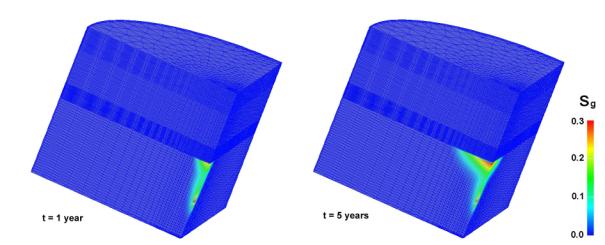
Fig.3: The same as Fig. 2 with the silty layers replaced by clayey layers
In
this case as well, however, the amount of CO2 stored depends on the
finite element mesh resolution used to solve the sample problem. As expected,
the total amounts are practically the same as in the previous example, with a
large overestimation (more than 2 times) in the coarsest mesh.
Tab. 4:
The
same as Tab. 3 with the silty layers replaced by clayey layers
|
Mesh |
Clay #1 |
Sand #2 |
Clay #3 |
Sand #4 |
Total |
|
1 |
0.0 |
0.0 |
11.2 |
132.3 |
143.5 |
|
2 |
0.0 |
0.0 |
5.1 |
94.5 |
99.6 |
|
3 |
0.0 |
0.0 |
2.4 |
73.7 |
76.1 |
|
4 |
0.0 |
0.0 |
1.4 |
66.4 |
67.8 |
A
last simulation is performed assuming intermediate petrophysical properties for
the middle confining layer, i.e. permeability equal to 8·10-3 mD and
porosity equal to 0.08. Based on the results obtained from the previous
analysis, the finest mesh is used. The gas migration vs. time is shown in Fig.
4 for a few significant times. Note that a fraction of injected CO2
(about 7 %) escapes from the lower sandy formation after 5 years, thus
confirming the importance of an accurate local rock characterization for a
reliable prediction of the storage safety.
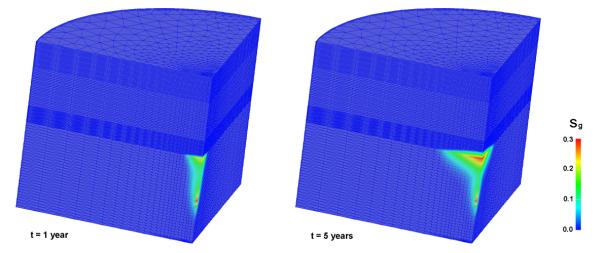
Fig.4: The same as Fig. 2 and Fig. 3 with the middle confining layer made of a silty clay with intermediate petrophysical properties
CONCLUSIONS
A
finite element model is used to investigate the impact of vertical mesh
resolution on the injection of gaseous CO2 in a layered porous
medium at the depth of about 1200 m. Simulations are performed at a local scale
assuming that the layers confining the sandy formations consist of either silt
or clay with the typical petrophysical properties of the Northern Adriatic
sedimentary basin. Injection is controlled by a Dirichlet boundary condition on
gas saturation (Sg = 0.3
at the depth of 1183 m). The gas bubble migration in a 5-year injection test is
simulated with different finite element vertical discretizations. The following
points are worth summarizing:
·
the
numerical solution converges to the analytical solution as the grid is refined;
·
the
amount of injected CO2 is significantly influenced by the vertical
finite element resolution and is overestimated by a factor larger than 2 in the
coarsest mesh;
·
the
finite element discretization is particularly important at the interface
between porous media with an abrupt permeability jump. If the grid is not
sufficiently refined, the amount of gas migrating through low permeable
barriers may be largely overestimated and the corresponding storage safety not
effectively simulated;
·
the
knowledge of the real local litho-stratigraphy and hydraulic conductivities is
of paramount importance for a reliable prediction of the injected gas
migration. In fact, if the confining layers are wrongly interpreted as
semipervious the CO2 bubble may quickly migrate toward the surface,
casting doubts on the safety of sequestration.
ACKNOWLEDGEMENTS
This
study has been funded by the University of Padova project “CO2
Sequestration in Geological Formations: Development of Numerical Models and
Simulation of Subsurface Reservoirs of the Eastern Po Plain”.
REFERENCES
[1]
Keeling, C.D. and Whorf, T.P., “Atmospheric CO2 records from
sites in the SIO air sampling network”, Trends:
A compendium of data on global change, Carbon Dioxide Information Analysis
Center, Oak Ridge National Laboratory, U.S. Department of Energy, Tenn.,
U.S.A., 2002. http://cdiac.esd.ornl.gov/trends/trends.htm
[2]
Marland, G., Boden, T.A. and Andres, R.J., “Global, regional, and
national fossil fuel CO2 emissions”. Trends: A compendium of data on global change, Carbon Dioxide
Information Analysis Center, Oak Ridge National Laboratory, U.S. Department of
Energy, Tenn., U.S.A., 2002. http://cdiac.esd.ornl.gov/trends/trends.htm
[3]
IEA Greenhouse and R&D Programme, “Carbon dioxide disposal from power stations”, 1998. http://www.ieagreen.org.uk/sr3p.htm
[4]
Vargaftik, N.B., Vinogradov, N.B. and Yargin, V.S., “Handbook of physical proprieties of liquids and gases” (3rd
edition), Begell House, New York, 1996, 1359 pages.
[5]
Gunter, W.D., Wiwchar, B. and Perkins, E.H., “Aquifer disposal of CO2-rich
gases: Reaction design for added capacity”, Energy
Convers. Mgmt., 1993, vol. 34, pp. 941-948.
[6]
Gunter, W.D., Wiwchar, B. and Perkins, E.H., “Aquifer disposal of CO2-rich
greenhouse gases: extension of the time scale of experiment for CO2
sequestering reactions by geochemical modeling”, Mineral. and Petrol., 1997, vol. 59, pp. 121-140.
[7]
Xu, T., Apps, J.A. and Pruess, K., “Analisys of mineral trapping for CO2
disposal in deep aquifers”, Technical
Report LBNL--46992, Lawrence Berkeley National Laboratory, California,
2000.
[8]
Peaceman, D.W., “Fundamentals of
Numerical Reservoir Simulation”, Elsevier, Amsterdam, 1977.
[9]
Aziz, K. and Settari, A., “Petroleum
Reservoir Simulation“, Applied Science Publishers, London, 1979.
[10]
Helmig, R., “Multiphase flow and
transport processes in the subsurface. A contribution to the modeling of
hydrosystem”, Springer-Verlag, Berlin, 1997, 367 pages.
[11]
Comerlati, A., Gambolati, G., Putti, M. and Teatini, P., “A preliminary
numerical model of CO2 sequestration in a normally consolidated sedimentary basin”, Computational Methods in Water Resources,
S.M. Hassanizadeh et al. editors, Elsevier Science, Amsterdam, The Netherlands,
2002, pp. 217-224.
[12]
Paniconi, C. and Putti, M., “A comparison of Picard and Newton
iterations in the numerical solution of multi-dimensional variably
saturated flow problems”, Water Resour. Res., 1994, vol. 30, pp. 3357-3374.
[13]
Gambolati, G., Putti, M. and Paniconi, C., “Projection methods for the
finite element solution of the dual-porosity model in variably saturated porous
media”, Advances in Groundwater Pollution
Control and Remediation, M.M. Aral editor, vol. 9 of NATO ASI Series 2:
Environment, Kluwer Academic, Dordrecht, Holland, 1996, pp. 97-125.
[14]
Ferronato, M., Gambolati, G., Teatini, P. and Baù, D., “Interpretation
of radioactive marker measurements in the Northern Adriatic gas fields”, SPE Reserv. Eval. Eng., 2003, submitted.